GitHub repo visualizer: which kind you need, and how to get it
Written by GitDiagram. Checked on (sources).
A GitHub repo visualizer can mean four different pictures. For the architecture, the main parts and how they connect, replace hub with diagram in the repository's URL: GitDiagram shows an interactive diagram in your browser, free, with nothing to install or clone. For the commit history and branches, use git log --graph or Gource. For the folder structure, a treemap or circle-packing picture such as GitHub Next's repo-visualizer Action (now archived). For package dependencies, GitHub's dependency graph or an import-graph tool such as dependency-cruiser.
The four kinds, and what draws each
- Architecture: the main parts and how they connect. Change
github.com/owner/repotogitdiagram.com/owner/repo, or paste the URL on the home page. The diagram groups the main components, labels the connections and links each part to its code. Good for understanding a project you have never seen. - History: commits and branches.
git log --graph --oneline --alldraws the branch graph in a terminal, and most Git clients draw it too. Gource turns a repository's history into an animation of who changed what over time. - Structure: folders and file sizes. GitHub Next's repo-visualizer was a GitHub Action that drew the folder tree as an SVG on every push; it still works as an example but the repository is archived. GitHub's own file browser and
treein a terminal are the plain versions. - Dependencies: packages and imports. GitHub's dependency graph lists the packages a repository depends on, from its manifests and lockfiles. For the imports between your own modules, run dependency-cruiser or Madge for JavaScript, or
pydepsfor Python.
Example: React's repository as an architecture diagram
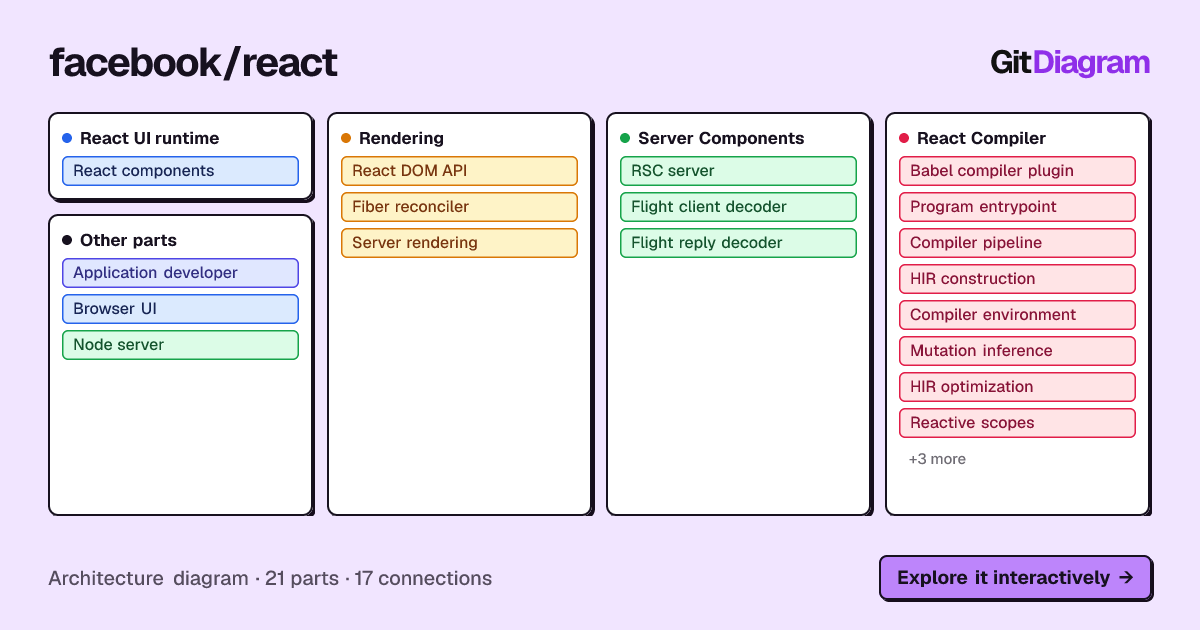
React's diagram (made 2026-10-05) has 21 parts in 4 groups and 17 connections. The runtime path goes from components (packages/react) to the React DOM API and the Fiber reconciler, which updates the browser UI; server rendering and React Server Components sit beside it. The largest group is the React Compiler, a pipeline from the Babel plugin through HIR construction, mutation inference and reactive scopes, with a Rust compiler pipeline under compiler/crates. That split, a runtime and a compiler in one repository, is the first thing a newcomer needs and the hardest to see from the folder tree.
Comparing the tools
The codebase visualization tools roundup compares GitDiagram, DeepWiki, Sourcegraph, dependency-cruiser, Madge, pydeps, Mermaid, PlantUML, Structurizr and coding agents, with each one's price and limits.
GitDiagram's diagram is made by an AI model from the file tree, the README and up to 12 source files. It is a map of the important parts, at most 34 of them, not a complete dependency graph: it can simplify or leave things out, every linked path is checked against the real repository, and it shows the repository as it was when the diagram was made (Regenerate makes a fresh one).
Questions
Is there a site where you change the GitHub URL to see a diagram of the repo?
Yes. Replace hub with diagram in the URL: github.com/facebook/react becomes gitdiagram.com/facebook/react.
Can I visualize a GitHub repository without cloning it?
Yes. GitDiagram reads the repository through GitHub and shows the diagram in your browser. History and import-graph tools usually need a local clone.
Sources
Checked on . Products change: if something here is out of date, open an issue.